I conducted a generative user research project to produce an impactful collection of data & data visualizations about the experiences of people living with Premenstrual Dysphoric Disorder (PMDD).
I hope that these findings can be shared & used to help inform design processes aimed at benefitting those living with PMDD symptoms.
My Role
• Planned & developed research protocol • Conducted a survey • Gathered, coded, & analyzed data • Created data visualizations using best practices • Created video presentation to showcase the project
Tools
• Figma • Miro • Adobe CC • Google Workspace • Social Media
Research
Survey: 60 participants
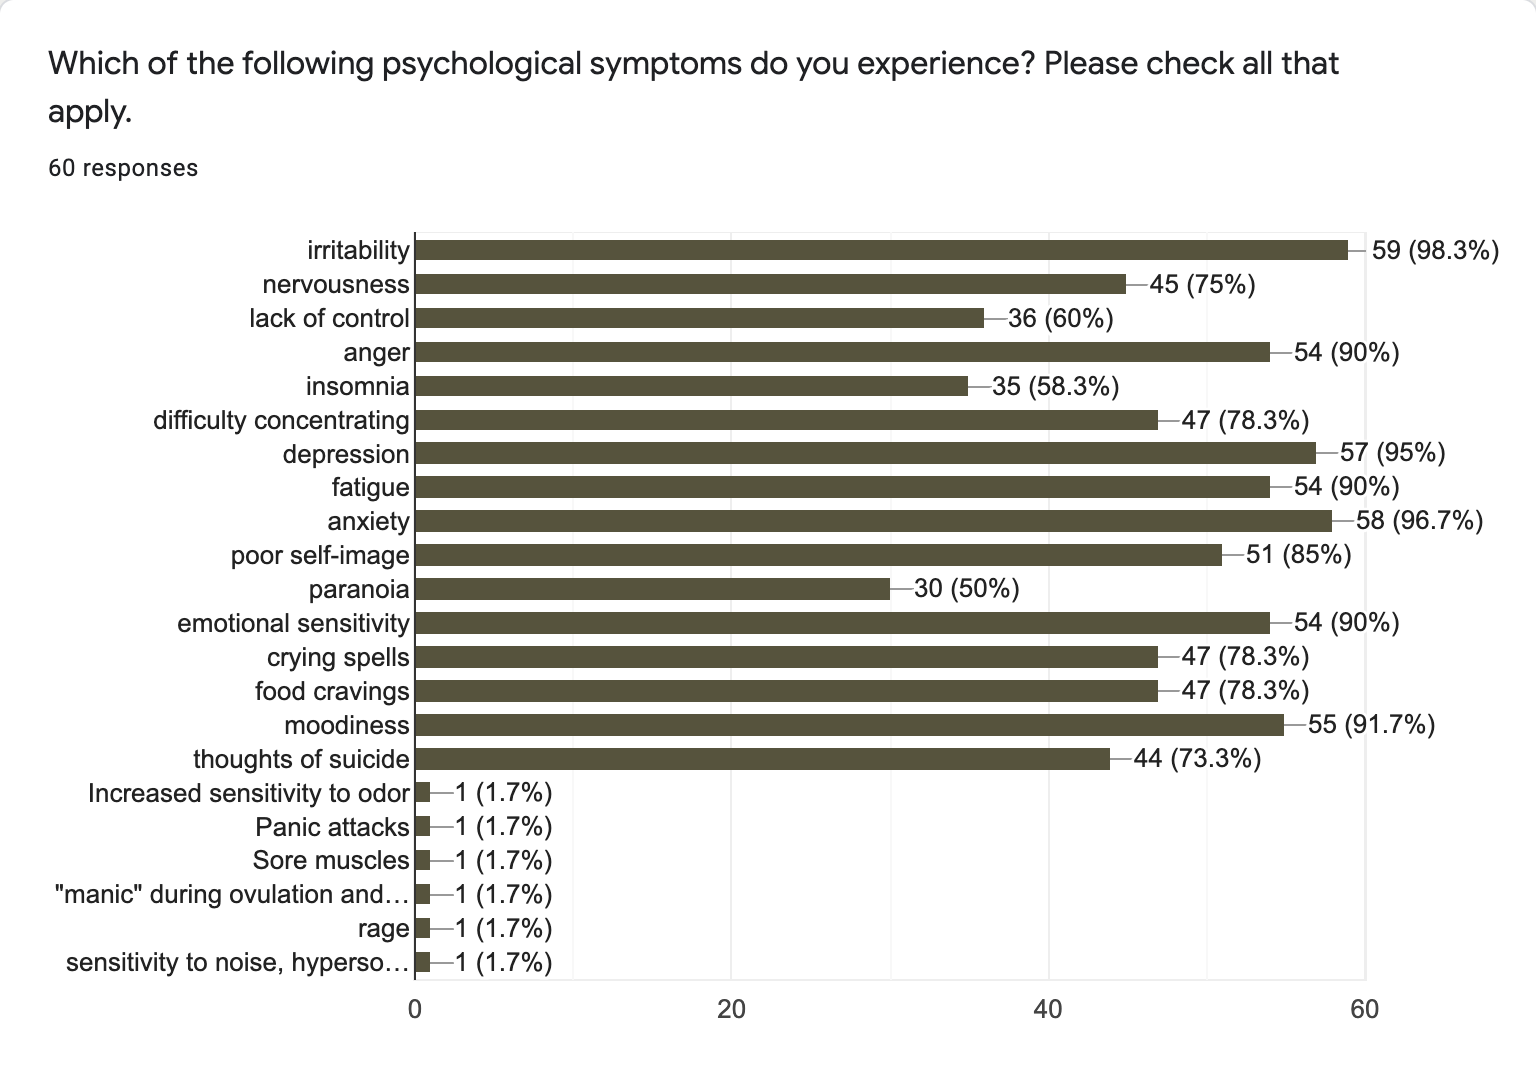
Survey question results for “Which of the following psychological symptoms do you experience? Please check all that apply”
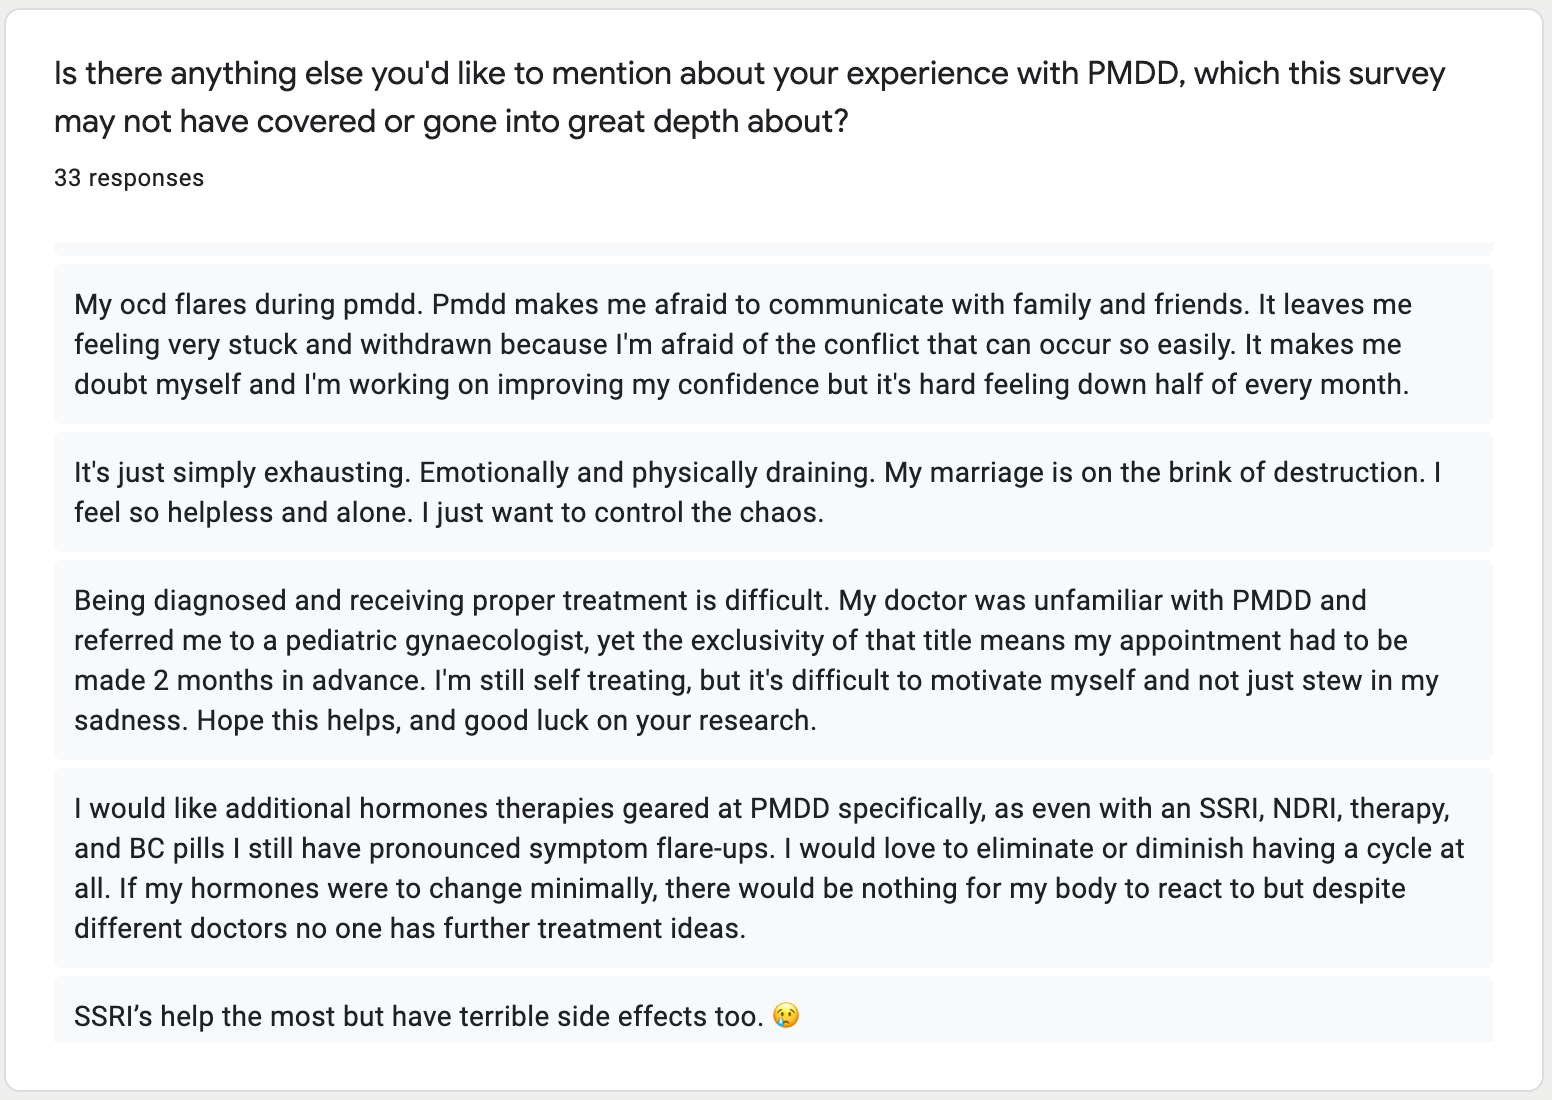
Survey question results for “Is there anythng else you’d like to mention about your experience with PMDD, which this survey may not have covered or gone into great depth about?”
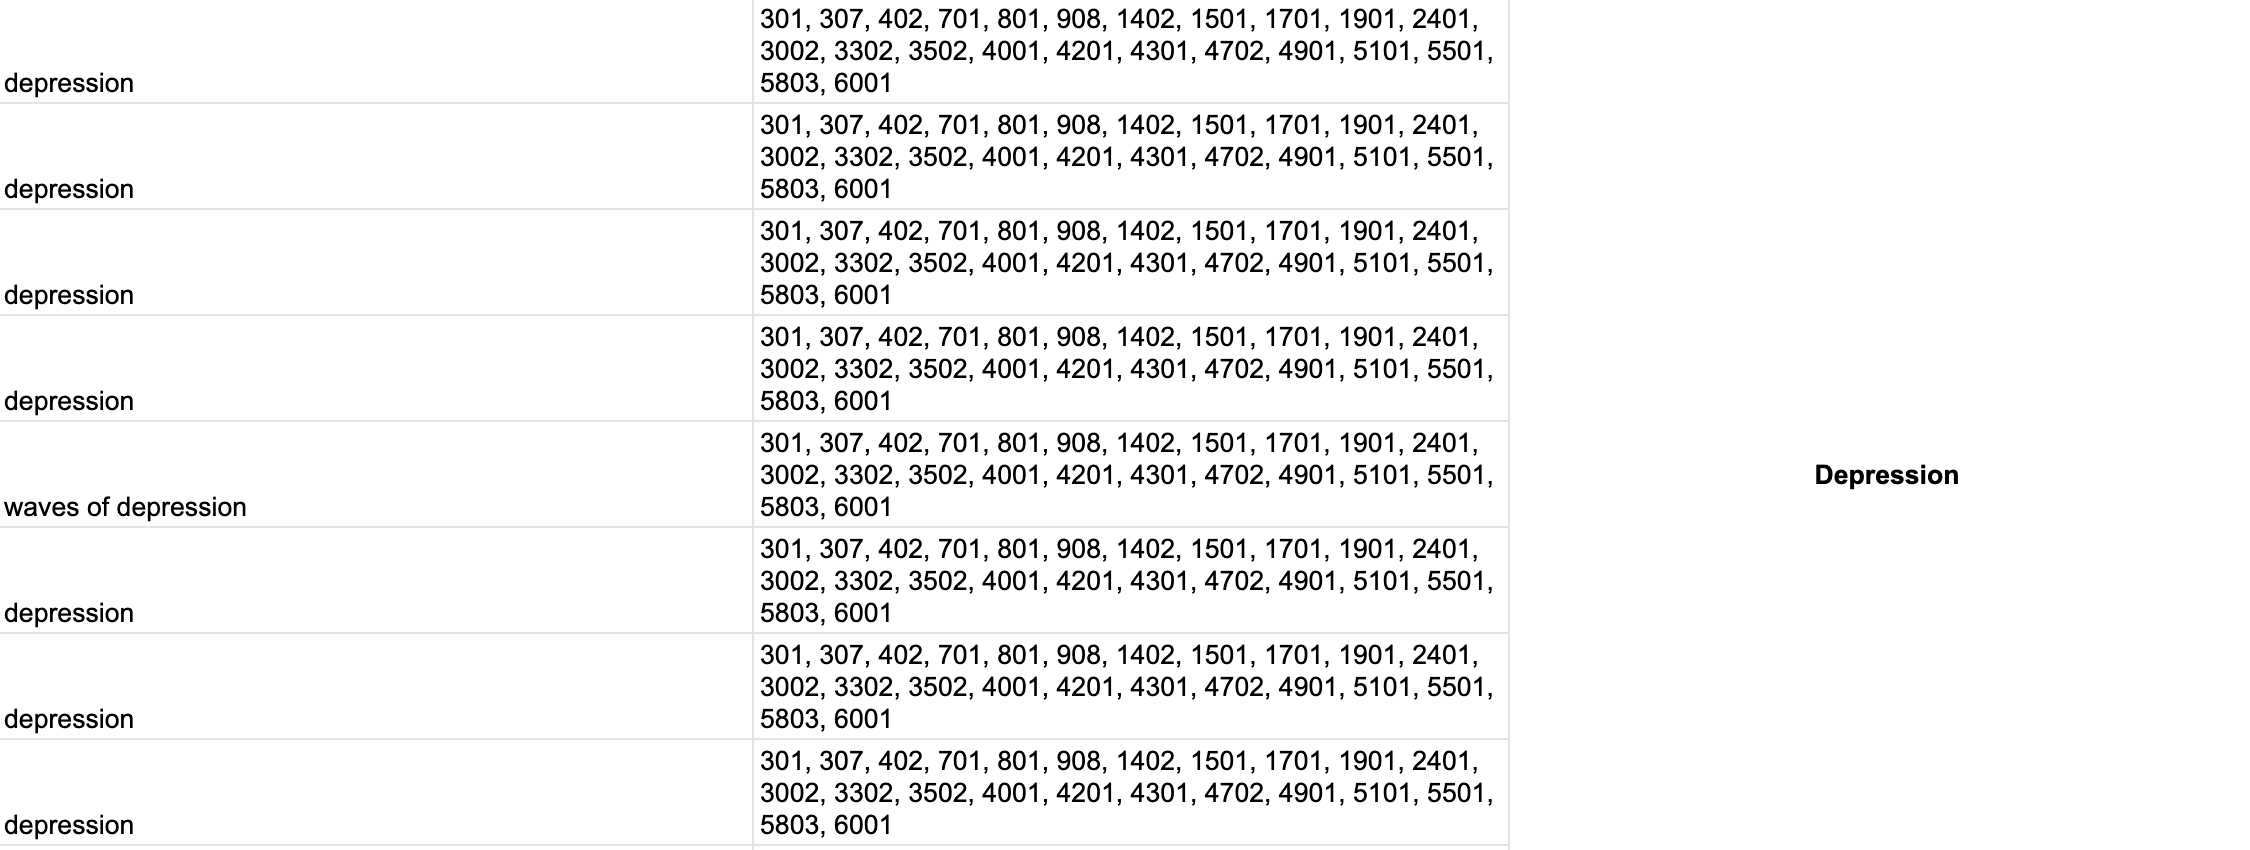
Coding the Data
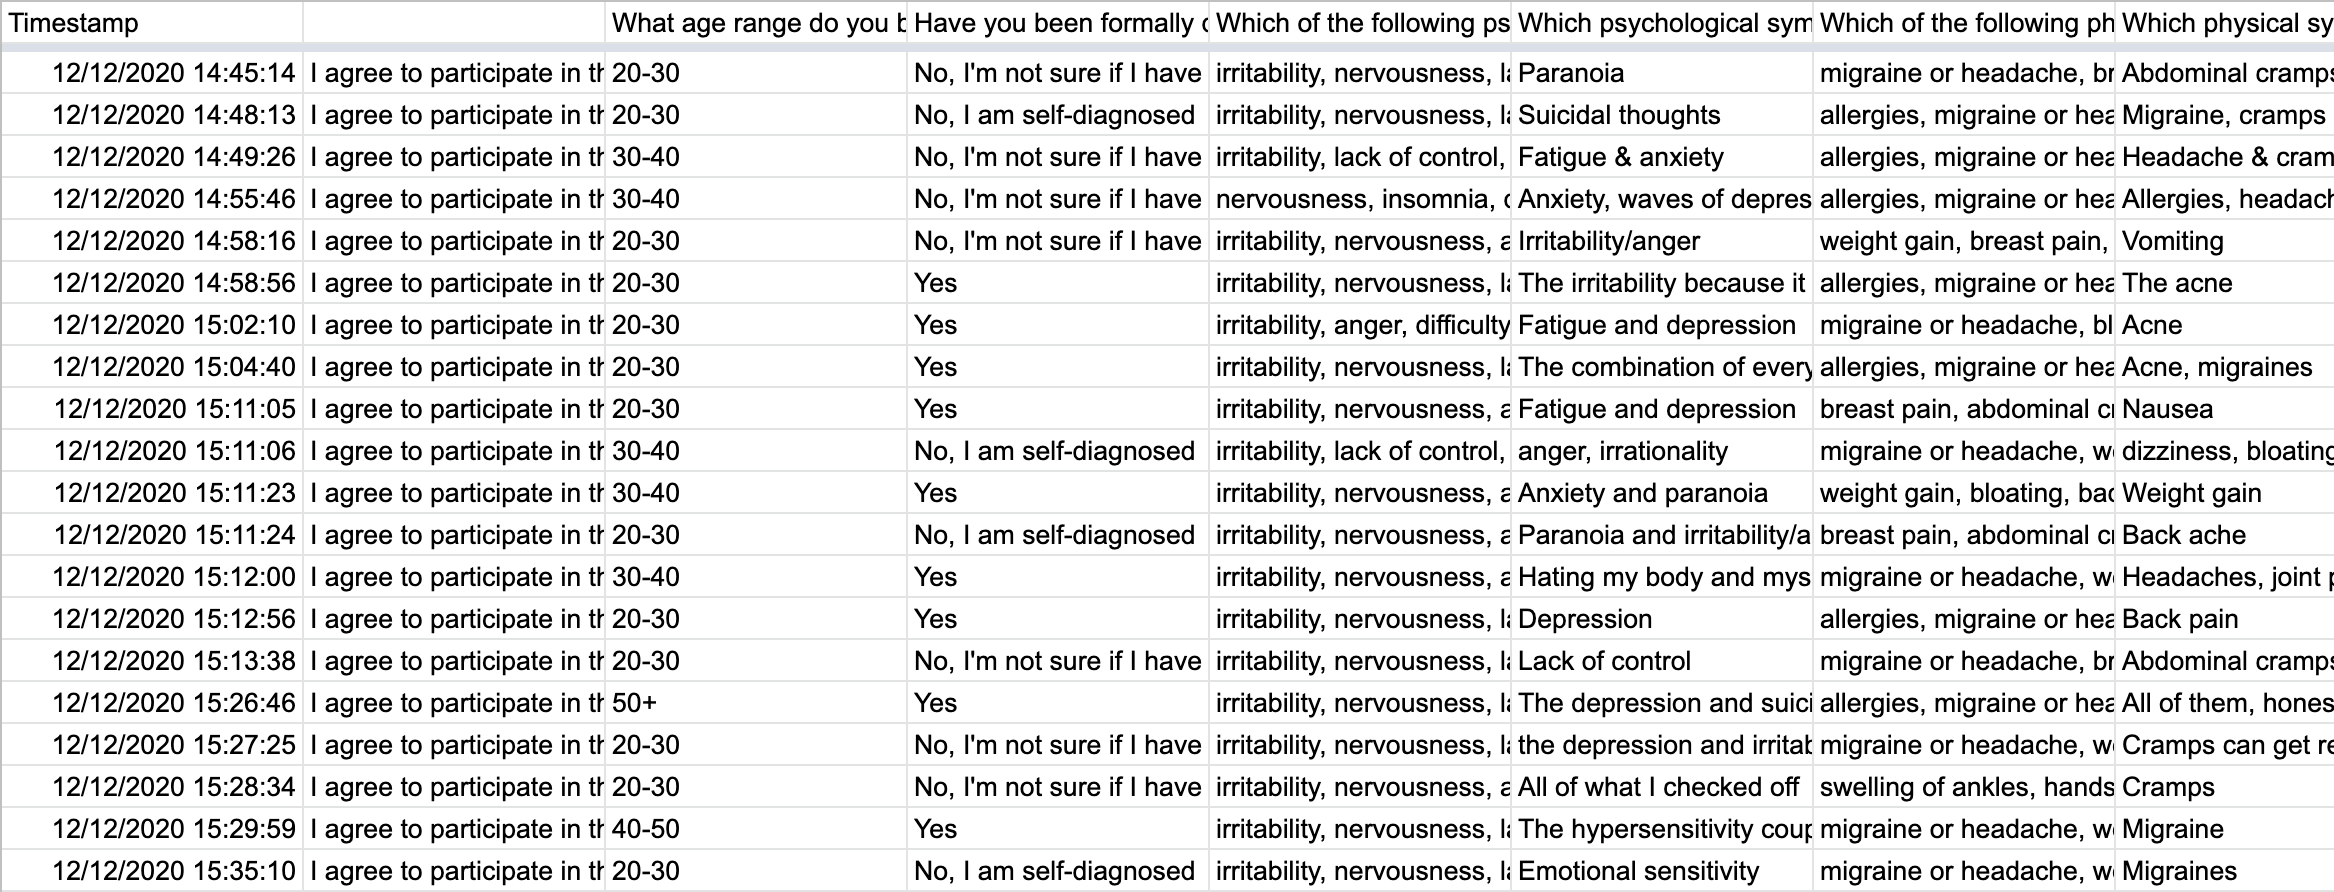
Raw data
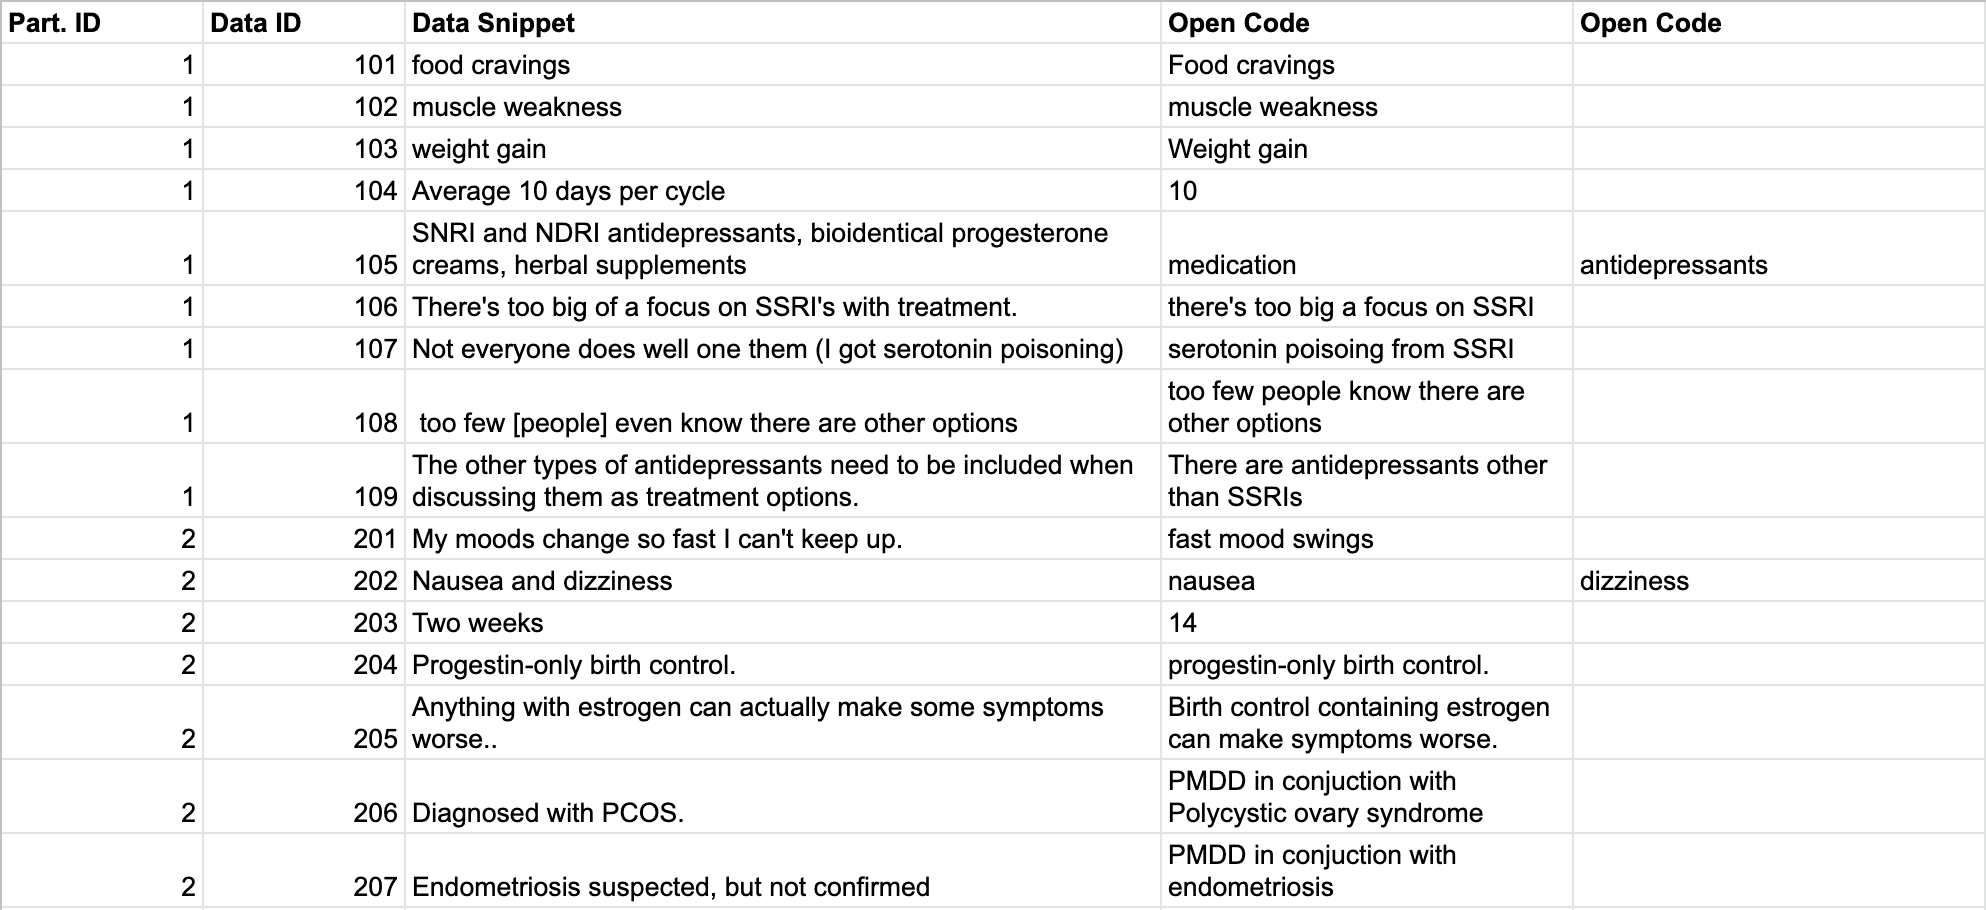
Open coding
Axial coding
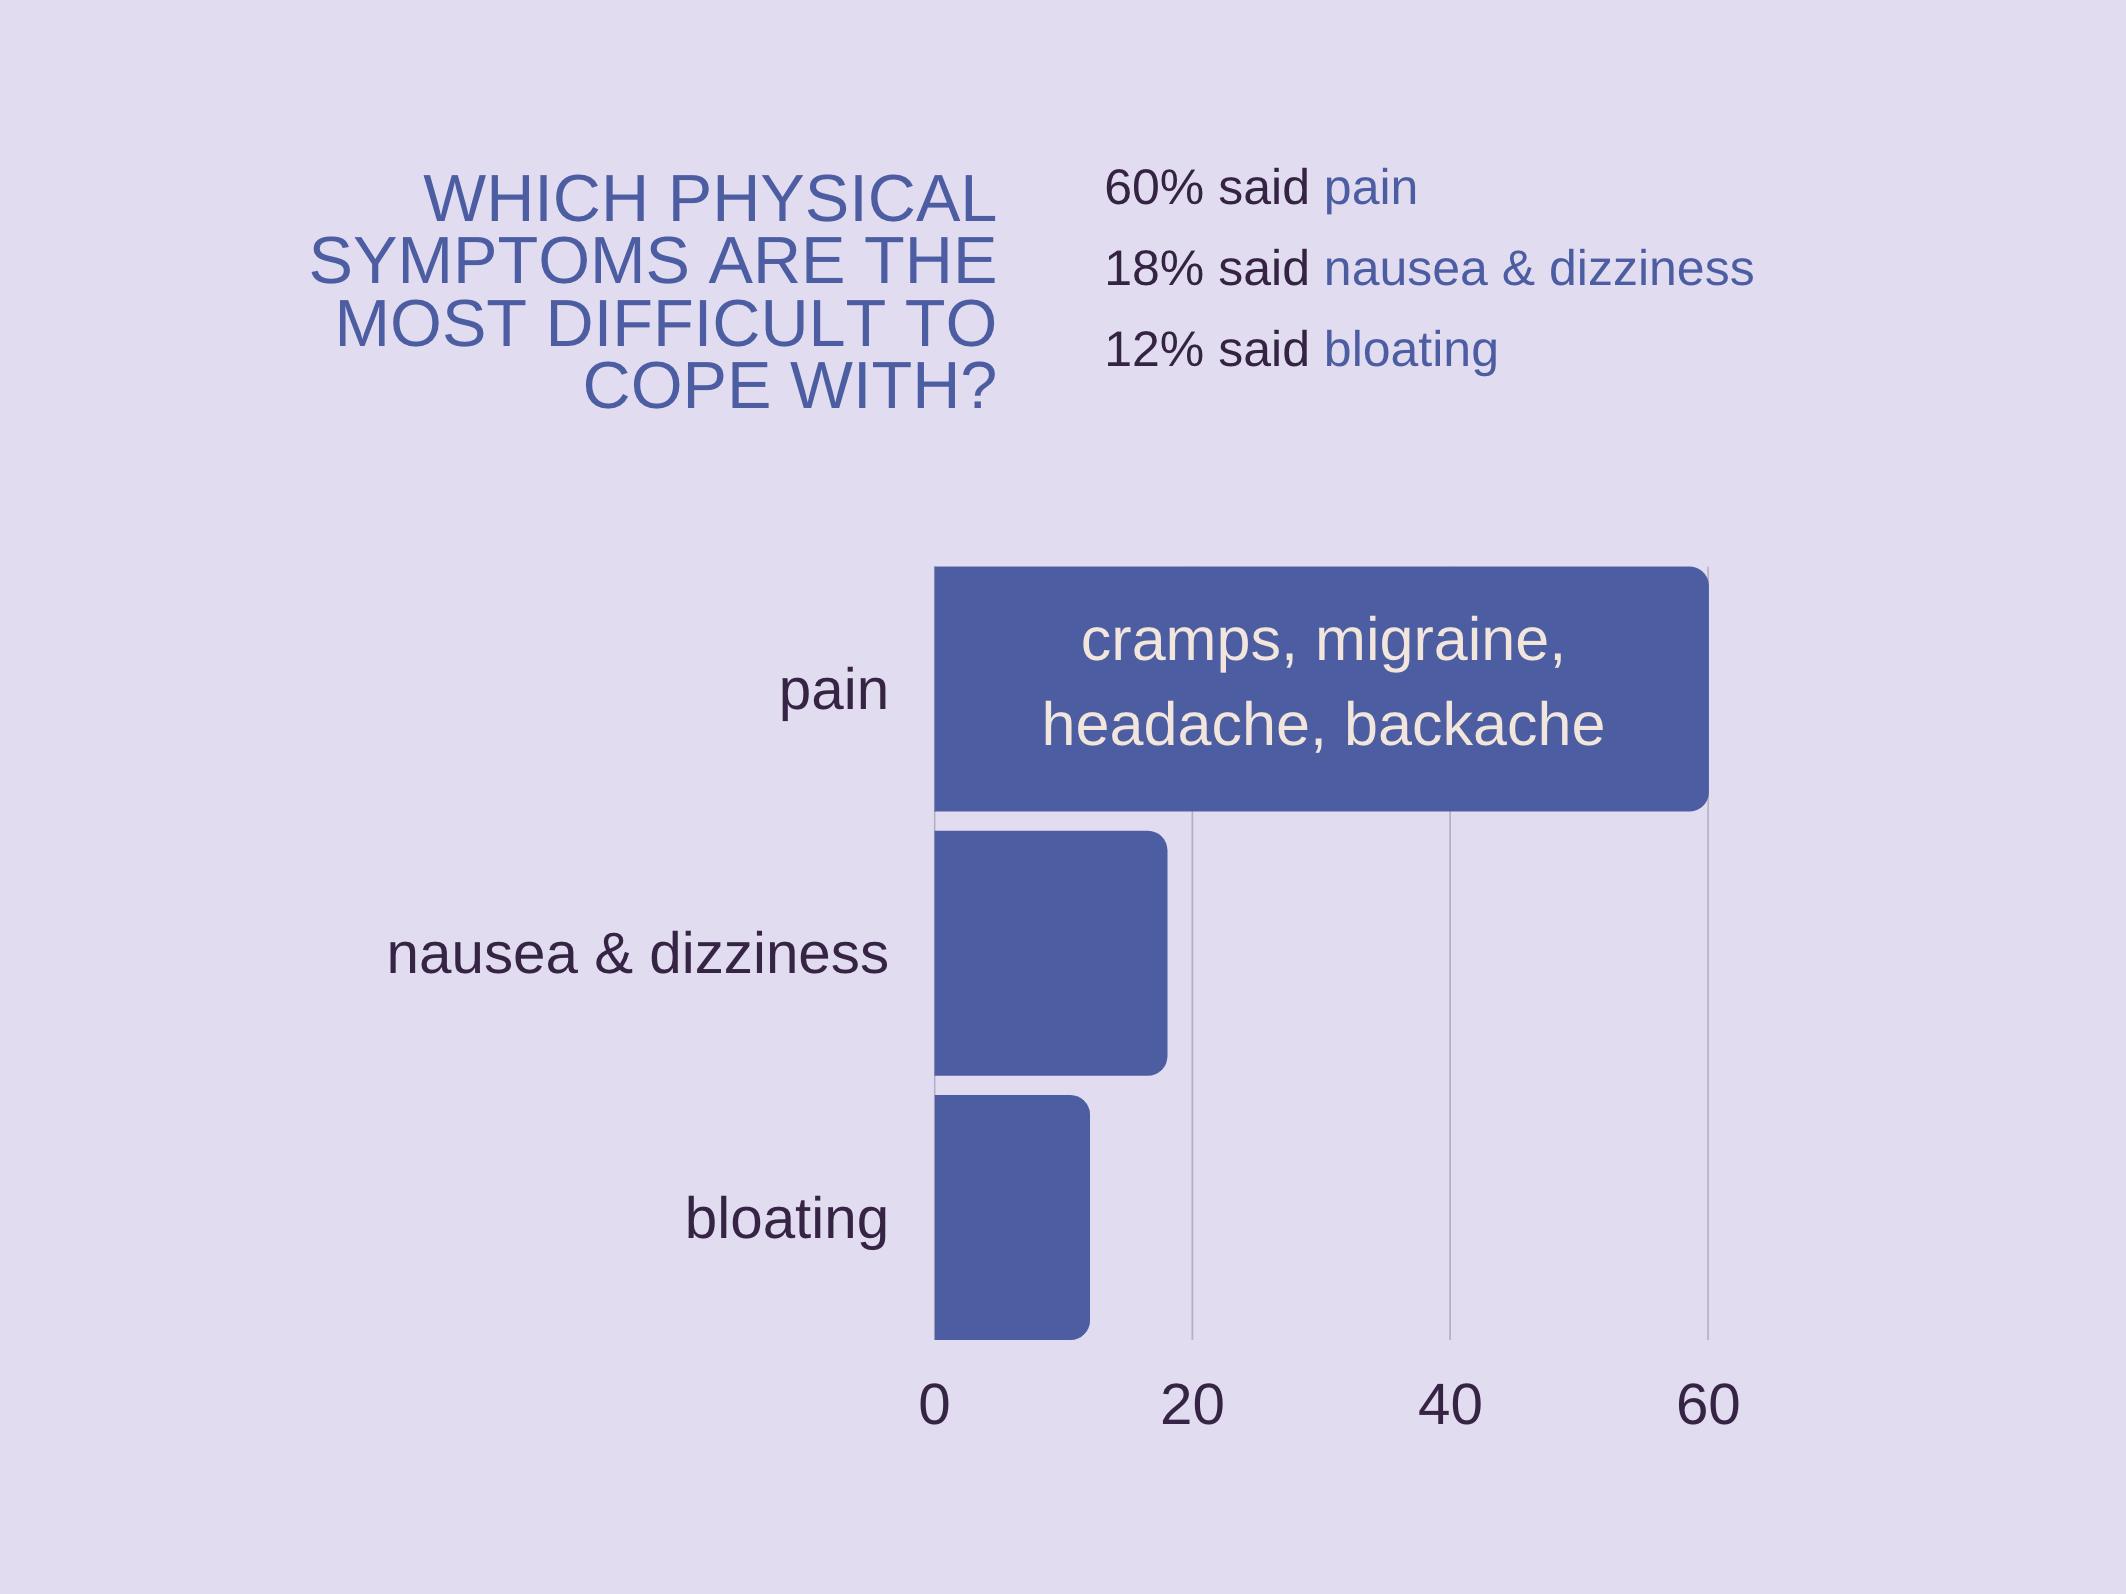
Data Visualization
I crafted data visualizations that are readable, succinct, and would work well as shareable social media posts.
Lessons Learned
Sensitivity is key when researching: I was surprised to receive survey responses angry at me for conducting a non-medical survey on PMDD. These participant responses challenged me as a researcher to reflect on the validity of my work and pushed me to take a step back and think about what it is that I want to do and what it is that I can actually accomplish with this project.
UX can’t solve every problem: In certain situations, a new app or website isn’t the solution.